
How to Avoid Overfitted EAs — A Practical Pre-Purchase Checklist
Introduction
“Amazing backtest,” “90% win rate” — attractive claims, but they may signal overfitting. An overfitted EA is over-optimized to past data and tends to fail in live trading. Below is a practical, quick-to-use flow to help buyers spot overfitting before they commit.
What is overfitting? (1-minute read)
- It’s when parameters are tuned to random past noise, creating a past-only optimizer that won’t generalize.
- Typical symptom: Backtests show a high PF, but in live (or a different period) the PF collapses and DD jumps.
How to spot an overfitted EA
1) Unnaturally high win rate × small RR
If win rate sits around 80–95% while RR < 1 (average win < average loss) or RR is very small, that’s the classic “many tiny wins, occasional huge loss” profile. Grid/martingale risk is common here.
- Aim for RR = Avg win ÷ Avg loss ≥ 1.2–1.5.
- Check that Largest loss is not several times the average win.
- Be wary if the backtest shows almost no losses — inspect how the EA loses, not just how it wins.
Related article: Stop Chasing Win Rate: Expectancy & Risk-Reward (RR)
2) High PF with too few trades
Example: 100–200 trades with PF ≈ 2.3 → could be luck or over-tuning. The fewer the trades, the easier it is to overfit.
- Realistic cue: same logic with ≥ 500 trades (ideally ≥ 1,000) and PF ≈ 1.3–1.8.
- If PF is much higher, re-check trade count and cost realism (commissions/spread/slippage).
Related article: Profit Factor (PF) Explained: Benchmarks & Pitfalls
3) User backtesting is restricted
If you can’t backtest it yourself under your broker’s conditions, avoid it. The vendor may have tuned to one broker’s overly tight costs.
- Prefer EAs you can backtest on your own and verify similar tendencies.
4) Backtest period is restricted/cherry-picked
Some EAs limit trading to a subset of dates in code (e.g., only trading after 2018 even if you test from 2010, or skipping specific “bad” days).
- Inspect the trade history and the chart with orders — look for suspicious no-trade spans.
Live forward results are essential
Over-optimized systems draw beautiful curves in backtests but often fail live. Verified real-account forward is the most important cross-check.
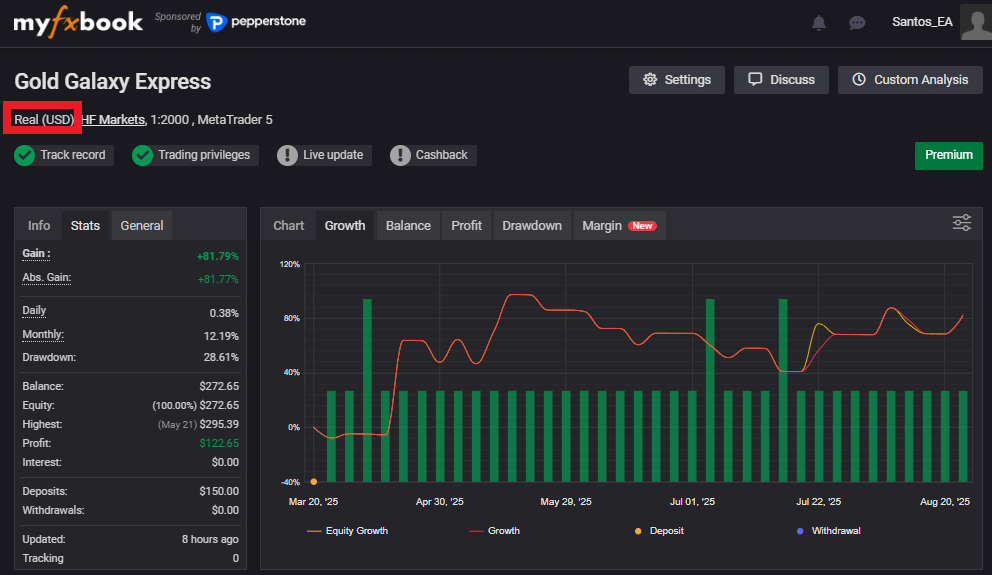
- On Myfxbook / FXBlue, confirm it’s a Real account (demos are reference only).
- Look for Track Record Verified and Trading Privileges Verified.
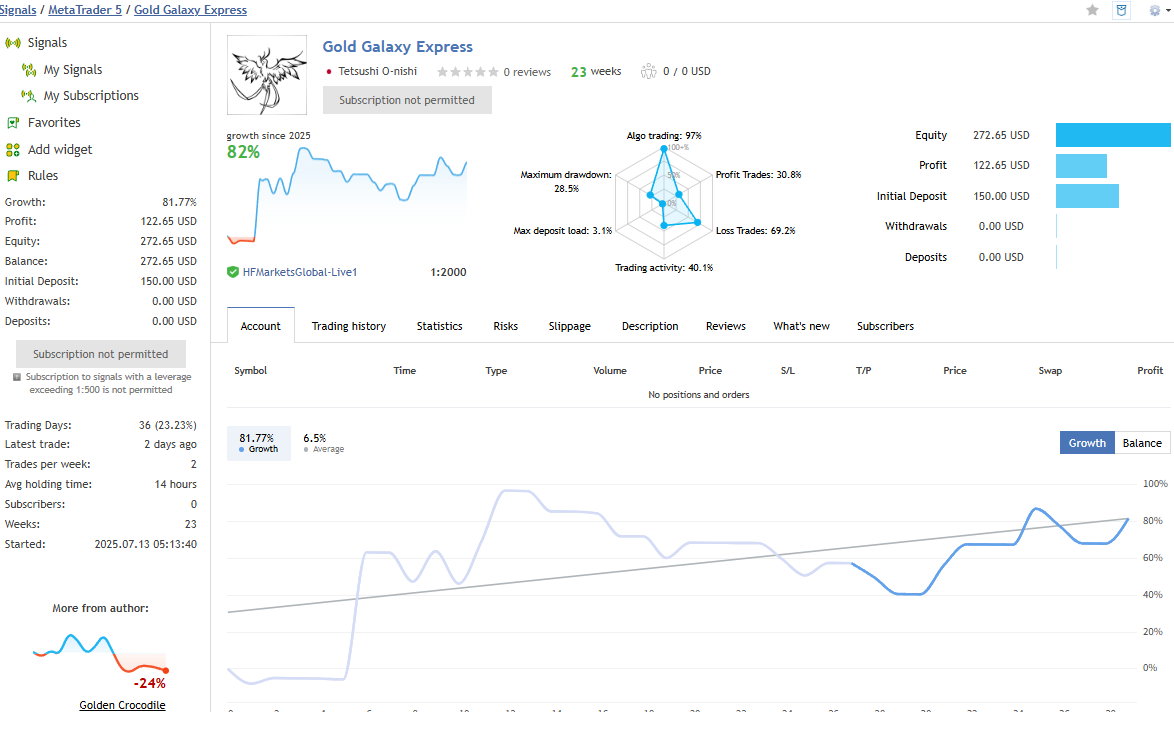
- MQL5 Signals are also useful; they list real accounts only.
- Compare monthly win rate, RR, PF, Max DD with the backtest. Patterns should be in a similar range.
Below are the results of our Gold Galaxy Express EA on Myfxbook and MQL5 real accounts (as of August 24, 2025).
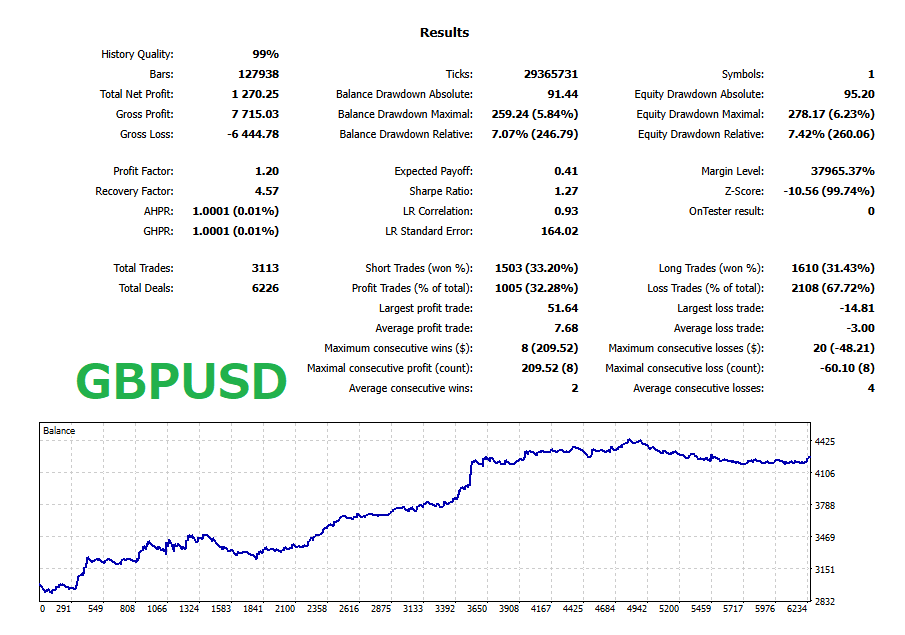
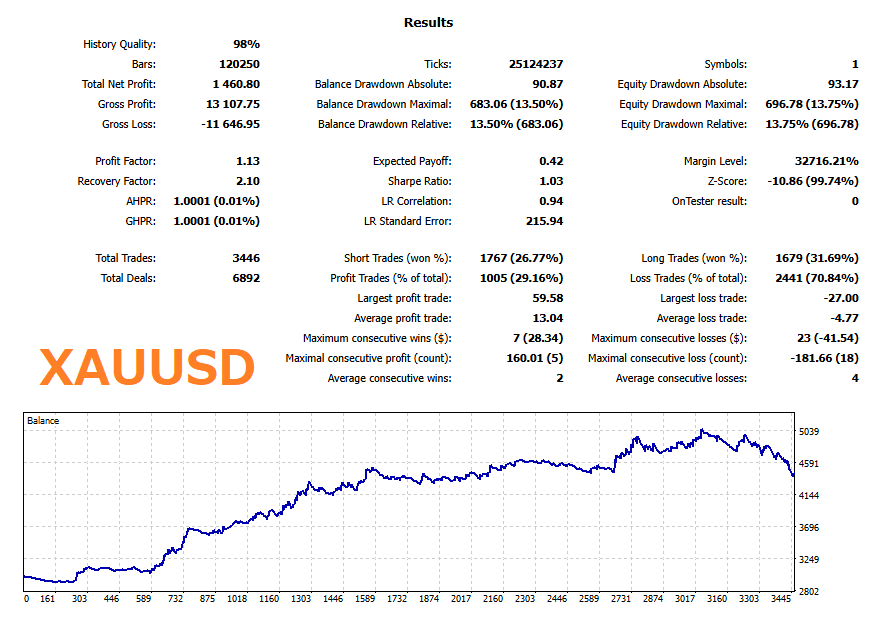
Ideal sanity check: works on other pairs too
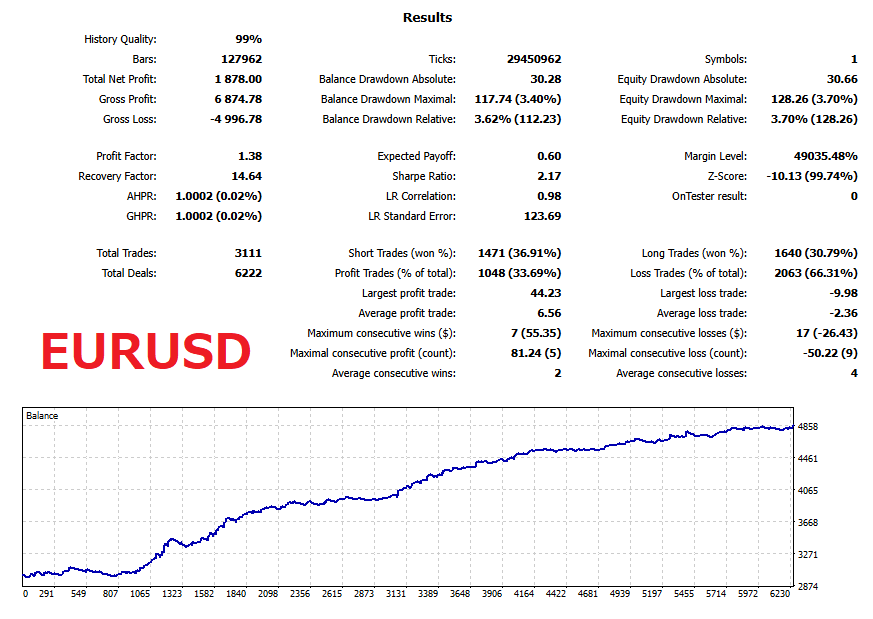
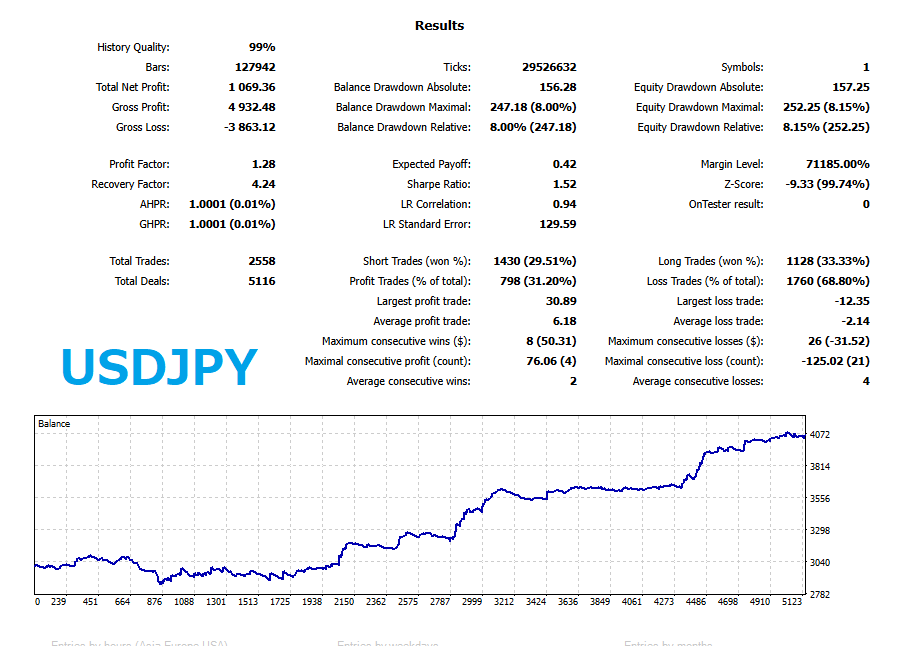
Overfitted EAs often succeed only on a single pair × timeframe. Run the same parameters on GBPUSD / USDJPY / XAUUSD, etc.
- If it doesn’t fall apart elsewhere, that hints at more robust logic.
- If only one pair looks great and others are terrible, suspect overfitting.
Lot Size: 0.1
10-minute due diligence before you buy
- Broker & account type: Which broker, account type (ECN/Raw/Cent), leverage, symbol suffix? Results that require one exotic account are fragile.
- Costs & execution: Were commissions, realistic spreads, slippage included in tests? Ask for exact numbers. “Fixed 0.1 pip” everywhere is not believable.
- Lot behavior: Check for stepping up lots after losses (hidden martingale). Verify Max lot vs starting balance and the rationale.
- Equity vs balance: On Myfxbook, compare equity curve to balance. Large gaps → floating drawdown or grid exposure.
- Deposits/withdrawals: Repeated deposits can mask drawdowns. Inspect the history line for cashflows aligned with DDs.
- Trade distribution: Look at average vs largest loss, consecutive losses, and average holding time. Very long tails with tiny average wins = danger.
- Time-of-day bias: If almost all profits come from one hour window, test sensitivity. Narrow edges often die first live.
- Stagnation: Ask for worst month, longest flat period, and Recovery Factor (Net profit ÷ Max DD). Vendors who share these are usually more trustworthy.
Red flags vs. green flags
Red flags
- Perfect equity with near-zero DD and very few trades.
- High win rate × low RR; largest loss dwarfs average win.
- No real-account forward or it’s frequently set to private.
- User backtests are blocked; broker/cost details are vague.
- Backtest dates look curated (no trades in tough regimes).
Green flags
- Real-account forward with verified tags, clear broker & costs.
- Reasonable stats: PF 1.3–1.8, RR ≥ 1.2–1.5, ≥ 500 trades on the same logic.
- Vendor shares .set files, cost assumptions, worst-case months, and parameter sensitivity tests.
- EA behavior remains similar on secondary pairs (not necessarily profitable, but not catastrophic).
Summary: checklist you can use today
- Real-account public performance is available (top priority)
- Balance among trade count / PF / RR / DD looks reasonable
- Not just high win rate × low RR
- No grid/martingale signs (check lot progression & largest loss)
- No restrictions on user backtesting
- Doesn’t collapse on other pairs with the same settings
- Vendor discloses broker, costs, worst month, stagnation
Key idea: choose robustness over looks, and repeatability over headline numbers. Stick to these two and you’ll greatly reduce the odds of buying an overfitted EA.
FAQ
What does an “overfitted” EA mean in simple terms?
An overfitted EA is tuned to past market noise so that it looks excellent in backtests but fails to generalize in live trading or different periods. You’ll often see a sharp drop in PF and a spike in drawdown once conditions change.
How can I quickly tell if an EA is likely overfitted?
- Very high win rate (80–95%) paired with low risk-reward (RR < 1) or tiny RR.
- High Profit Factor (PF) with too few trades (e.g., 100–200).
- User backtesting is restricted or broker/cost details are vague.
- Backtest period appears cherry-picked with suspicious “no-trade” spans.
How many trades do I need before trusting PF or win rate?
As a rule of thumb, look for the same logic to produce ≥ 500 trades (ideally ≥ 1,000). Healthy systems often show PF ≈ 1.3–1.8 over substantial samples when realistic costs are included.
Are demo or cent accounts enough to validate an EA?
No. Use verified real-account forward results (e.g., Myfxbook/FXBlue with “Track Record Verified” and “Trading Privileges Verified,” or MQL5 Signals). Treat demos as reference only.
How long should forward testing run to be meaningful?
Long enough to capture multiple market regimes (months, not days). Compare live monthly PF, RR, win rate, and Max DD with the backtest. Patterns should be broadly similar, not identical.
Which trading costs must match live conditions in tests?
Commission, realistic spreads, and slippage. Ask vendors for exact assumptions. Be skeptical of unrealistically tight or fixed costs (e.g., “0.1 pip everywhere”).
How can I detect hidden grid or martingale behavior?
- Inspect lot progression after losses (stepping up lots is a red flag).
- Compare average vs largest loss—one outsized loss can erase many small wins.
- Check equity vs balance curves; large gaps suggest floating DD or grid exposure.
Should an EA also work on other pairs/timeframes?
Cross-pair checks are a great sanity test. Reuse the same parameters on pairs like GBPUSD, USDJPY, or XAUUSD. Robust strategies don’t collapse elsewhere (they may not be equally profitable, but shouldn’t be catastrophic).
What’s the 10-minute pre-purchase checklist?
- Public, verified real-account forward results.
- Balanced stats: trade count / PF / RR / DD are reasonable.
- No “high win rate × low RR” trap; no grid/martingale signs.
- Realistic costs in testing; broker/account type disclosed.
- Backtest period not cherry-picked; user backtesting allowed.
- Same settings don’t fall apart on secondary pairs.