
(For users: how to avoid choosing EAs by win rate alone)
Bottom line: beginners often assume “higher win rate = better EA,” but that’s not true. In fact, an unnaturally high win rate can be a red flag for grid/martingale–style risk that hides large losses. What really matters is the expectancy of each trade, which depends on the win rate and the size of wins versus losses.
1) The basic formula (expectancy)
Per-trade expectancy E tells you whether an EA tends to make or lose money over time:
E = Win rate × Average win − Loss rate × Average loss
- Win rate: probability of a winning trade (e.g., 60% → 0.6)
- Average win: average profit on wins
- Average loss: average loss on losers
If E > 0, the EA tends to grow the balance over the long run.
Quick example
- Win rate = 40% (0.4)
- Average win = 2,000 JPY
- Average loss = 1,000 JPY
E = 0.4 × 2000 − 0.6 × 1000 = 800 − 600 = +200 JPY
Even with a sub-50% win rate, expectancy is positive because wins are larger than losses.
2) RR (Reward:Risk) — why it matters
RR (Reward:Risk) means Average win ÷ Average loss. The larger the RR, the less win rate you need to break even.
Examples
- RR = 2 (e.g., take profit +200 / stop loss −100) → break-even win rate ≈ 33.3%
- RR = 0.5 (e.g., +50 / −100) → break-even win rate ≈ 66.7%
Break-even win rate quick table
| RR (avg win ÷ avg loss) | Break-even win rate |
|---|---|
| 0.5 | 66.7% |
| 1.0 | 50.0% |
| 1.5 | 40.0% |
| 2.0 | 33.3% |
| 3.0 | 25.0% |
Memory hook: Break-even win rate = 1 ÷ (RR + 1).
Takeaway: Win rate gives “peace of mind”, RR gives “survivability”. You need both.
Case study: reading RR & win rate from an MT5 report
Example (Gold Crab Robot EA, 0.01 lots fixed):
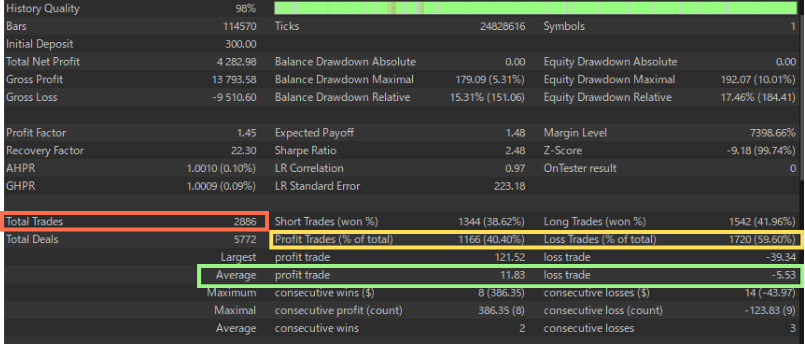
- Average profit trade = 11.83, Average loss trade = −5.53 → RR ≈ 11.83 ÷ 5.53 = 2.14
- Profit Trades (% of total) = 40.40% (low win rate)
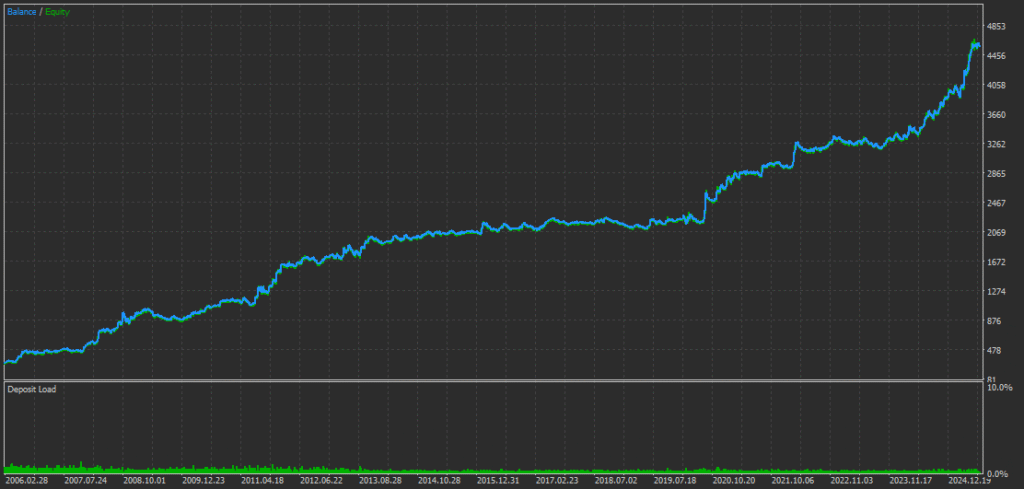
- Yet Total Net Profit = 4,282 USD → Expectancy is positive; the equity curve slopes upward.
This shows why “high win rate” alone does not define a good EA.
3) Also check PF (Profit Factor)
PF = Total gross profit ÷ Total gross loss (above 1.0 is a positive sign). With the same win rate, a small average win and large average loss will suppress PF. Always review Win rate + RR + PF together.
4) Don’t get fooled by small sample sizes
- Few trades = large “luck” component.
- For backtests, aim for ≥ 500 trades on the same logic; ≥ 1,000 is better for stability.
- Fewer trades make overfitting easier (parameters tuned to noise).
- Be wary of “many tiny strategies combined” to inflate trade count; more trades ≠ automatically more trust.
- Forward test: the longer the period, the more credible. One stellar month is often randomness.
5) Practical tips for real trading
- Don’t pick by win rate alone: check if expectancy is positive.
- Check RR: aim for wins that are clearly larger than losses (rule of thumb 1.5–2.0×+).
- Pair PF with max drawdown: same expectancy → prefer the EA with shallower drawdowns.
- Log monthly with fixed rules: win rate, avg win, avg loss, PF, max DD. Changing rules mid-evaluation distorts results.
- Diversify: combine EAs with different behavior to smooth overall drawdowns.
6) Caution: grid / martingale patterns
Be careful with EAs that show very high win rate but small RR (tiny wins, occasional huge losses).
- Typical signs: win rate 80–95%; Average win ≪ Average loss (RR < 1); long smooth gains then a rare large dump.
- How to spot: check RR, PF, max drawdown, “largest loss” together. Look for outsized losses and extreme equity drops during losing streaks.
7) Common misconceptions
- “90% win rate means safety” → one big loss can wipe months of gains.
- “PF alone is enough” → with few trades or a lucky streak, PF can mislead.
- “Last month was great, so I’ll buy it” → could be regime luck; extend period and sample size.
8) Summary checklist
- Expectancy E > 0 (use the basic formula)
- RR ≥ 1.5–2.0 if possible
- PF > 1
- ≥ 500 trades in backtest (ideally ≥ 1,000)
- Max drawdown within your personal tolerance
EAs that satisfy these tend to be more sustainable than those boasting win rate alone.
Appendix: what to read in the MT5 backtest image
① Win rate & trade count (in depth)
- Total Trades: aim for ≥ 500, ideally ~1,000 for stronger statistical confidence.
- Profit Trades (% of total): 40–60% is a natural middle ground. If it’s70–95%, re-check RR and largest loss for hidden tail risk.
- Long/Short win rates: large imbalance can hint at regime bias or over-tuning.
② Other must-watch fields for this article
- Average profit trade / Average loss trade → compute RR = Avg win ÷ Avg loss.
- Expected Payoff → average P/L per trade; should be positive and consistent.
- Profit Factor (PF) → above 1.0; be cautious if very high with few trades.
- Drawdown (Balance/Equity) → keep it within your comfort zone.
- Largest loss / Consecutive losses → look for outsized single losses or extreme drops during streaks.