
Table of Contents
- Article Aim (Key Points)
- Basics of Monte Carlo Analysis
- Example 1: Gold Crab Robot
- Example 2: “Blind Spots” of Monte Carlo
- Limitations of Monte Carlo Analysis and How to Handle Them
- Practical Checklist
- Common Misunderstandings and Warnings
- Conclusion
Article Aim (Key Points)
Monte Carlo Analysis = Randomly reshuffling win/loss sequences many times to measure the width of worst-case outcomes.
However, it has blind spots: unrealized losses (Equity DD), compounding lot sizes, and long-term price scale changes.
Using Gold Crab Robot and a custom Grid EA as examples, we’ll break down how to read the results and what to watch out for.
Basics of Monte Carlo Analysis
A backtest represents only “one history.”
Monte Carlo creates many alternate histories by reshuffling trade outcomes (resampling), then evaluates distributions of:
- Max Drawdown (MaxDD)
- Final Profit (CAGR equivalent)
- Losing Streaks
- Risk of Ruin
👉 In practice, traders focus on the pessimistic side (e.g., 95% confidence level) to size lots and capital.
Example 1: Gold Crab Robot
1) Backtest Overview (MT5 Report)
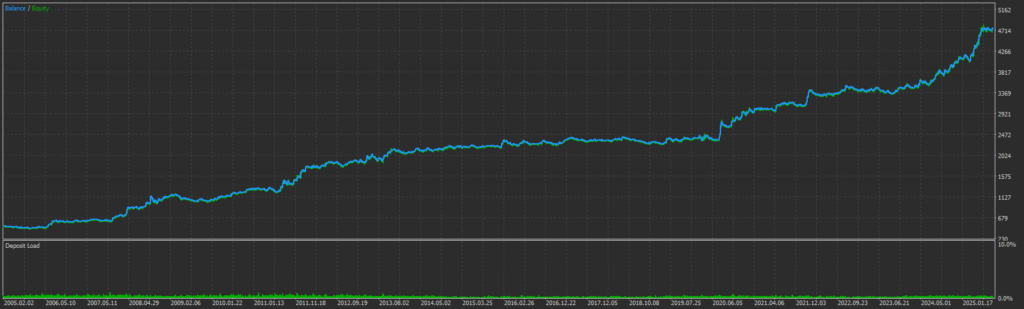
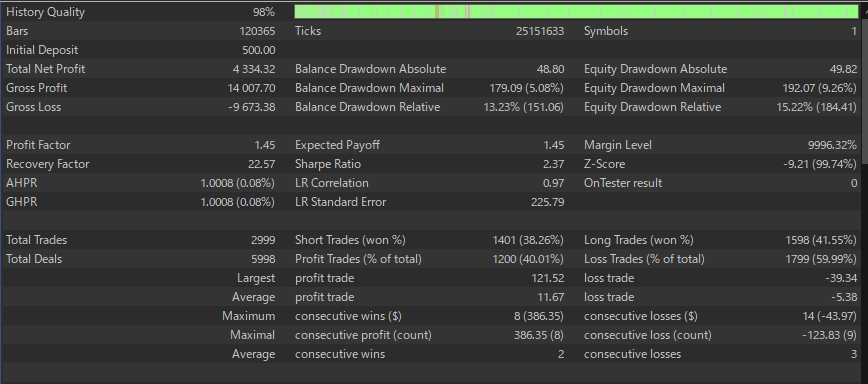
Main Metrics (Excerpt):
- Fixed 0.01 lot, initial deposit $500, total trades 2,999, win rate 40.01%
- Profit Factor 1.45, Sharpe 2.37, Recovery Factor 22.57
- Max Balance DD $179.09 (5.08%), Max Equity DD $192.07 (9.26%)
- Max losing streak 14 (-$43.97), avg. win $11.67, avg. loss -$5.38
👉 First, check the health of raw data (PF, DD, win/loss balance).
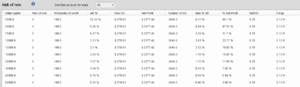
2) Results with Confidence Levels
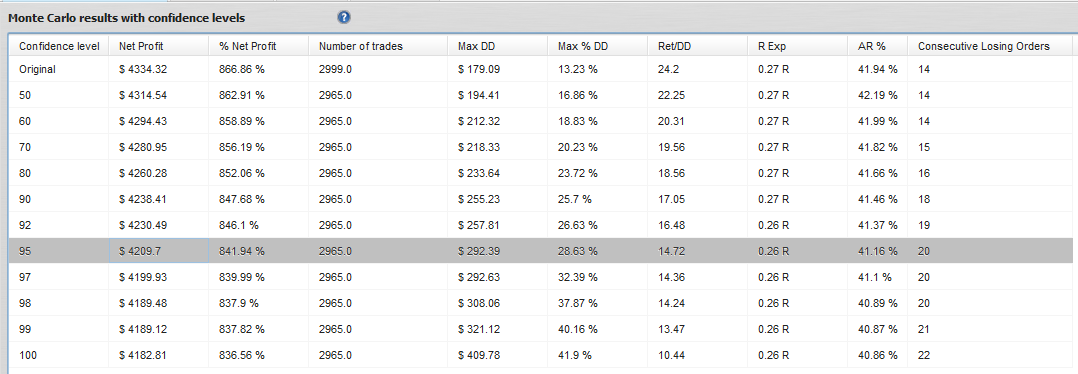
Reading the 95% row (key):
- Net Profit ≈ $4,209.7 (pessimistic profit expectation)
- Max DD ≈ $292.39, Max %DD ≈ 28.63%
- Ret/DD ≈ 14.72, Max losing streak ≈ 20
Lot sizing examples:
- Allowed DD = 20% → Lot multiplier ≈ 20 / 28.63 ≈ 0.70×
- Allowed DD = 30% → Lot multiplier ≈ 1.05× (still safer to keep ≤1.0×)
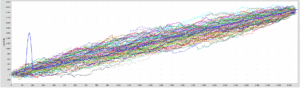
3) Monte Carlo Chart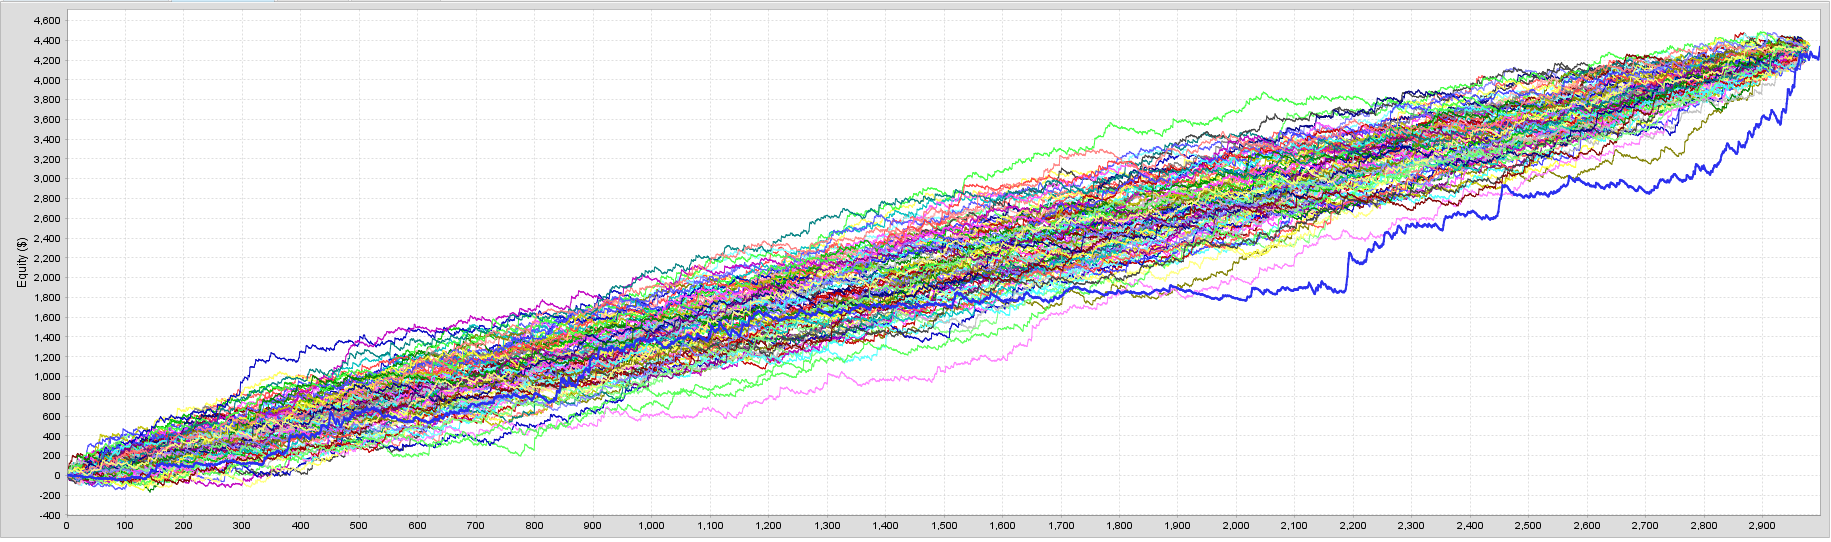
Key Points:
- Most paths slope upward, but lower-band (pessimistic) curves show dips.
- Safer to size lots based on the lower band.
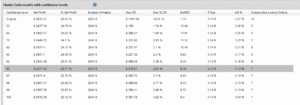
4) Risk of Ruin
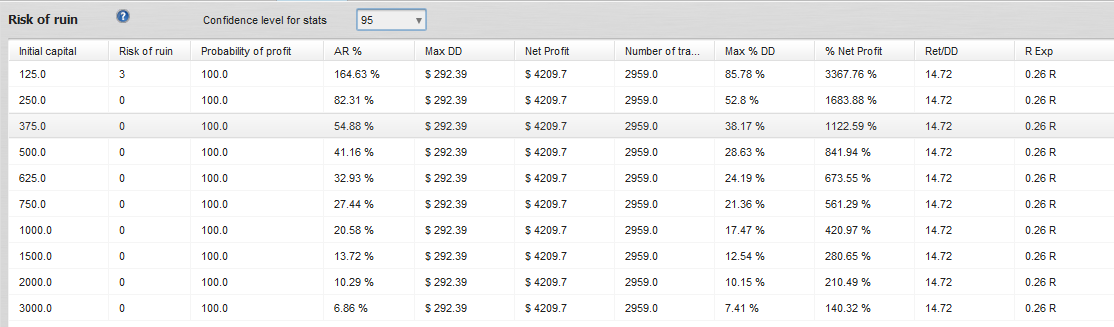
Examples:
- Initial balance $125 → Risk of ruin = 3%
- $250+ → 0% (under this model, unlikely to hit ruin zone)
⚠️ But: this assumes fixed lots only. For compounding or margin rules, reassess separately.
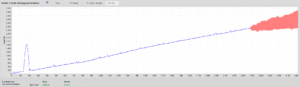
5) Predict / Verify (Future Projection)
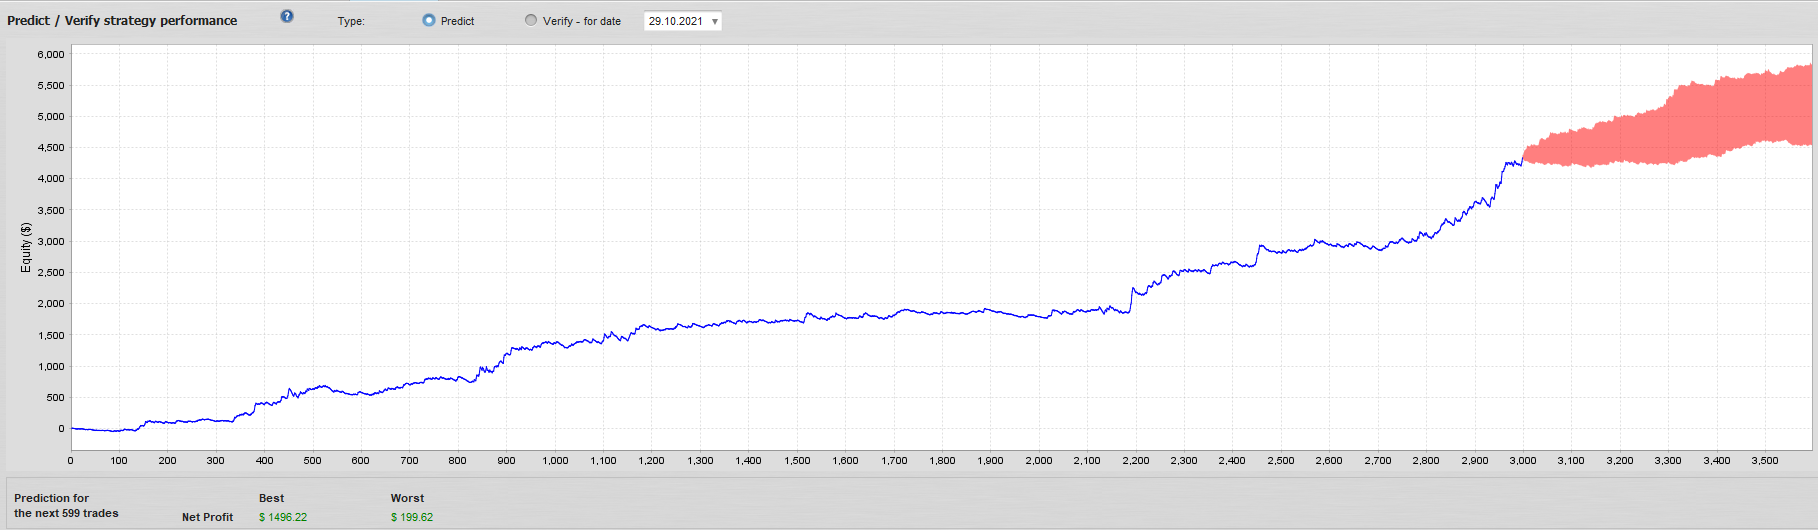
The red band = projection range for the next X trades.
👉 Practical rule: plan withdrawals and cash flow at the lower bound.
Example 2: “Blind Spots” of Monte Carlo
A) Unrealized Loss Spikes (Equity DD)
In a Sample Grid EA, even with fixed 0.01 lots on a $10,000 account, unrealized losses almost 50% of equity.
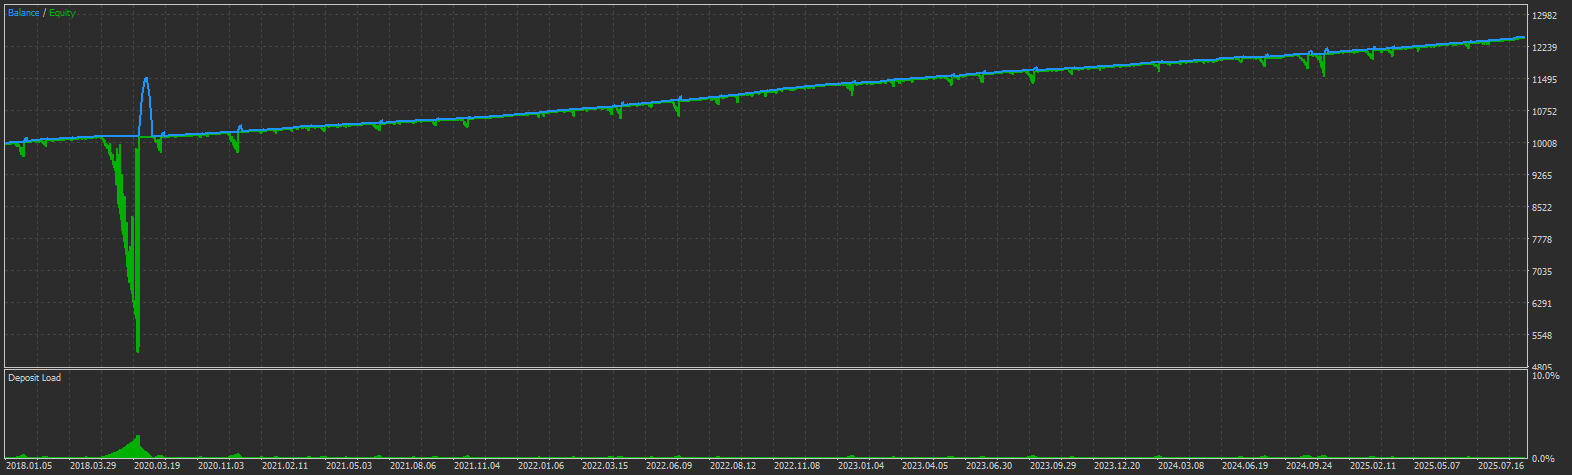
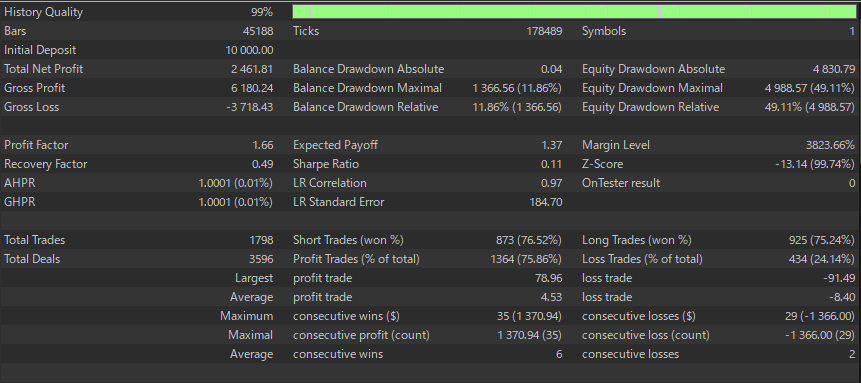
➡️ Since Monte Carlo works on closed trades only, it almost ignores such spikes.
B) Why Results Still Look “Good”
Monte Carlo tables and charts can still show:
- Smooth upward curves
- Low Max %DD values
👉 But risks like equity drawdown and margin exposure remain hidden. For Grid/Martingale EAs, this blind spot can be fatal.
Limitations of Monte Carlo Analysis and How to Handle Them
1) Equity DD not included
MC resamples closed trades → can’t capture large unrealized losses or margin calls.
Solutions:
- Use equity-based returns if tool supports.
- Monitor Max Equity DD, Margin Usage, MAE separately.
- Prioritize external monitoring for Grid/Martingale.
2) Not suited for compounding (variable lots)
MC assumes fixed lots. Balance-linked lots distort risk if just reshuffled.
Solutions:
- Evaluate compounding via EA backtest directly.
- If needed, resample % returns then apply compounding afterward (sensitive to assumptions).
3) Long-term price scale changes
XAUUSD ↑10× in 20 years, USDJPY ↑2×.
Fixed pip rules over decades distort results.
Solutions:
- Normalize by % returns or ATR multiples.
4) Streak dependence (autocorrelation)
Simple shuffle breaks winning/losing clusters.
Solutions: Use block bootstrap (5–20 trades) or regime-based resampling.
Practical Checklist
- Choose confidence level (e.g., 95%).
- Lot sizing: Allowed DD / Max %DD(95%) (≈28.63% for Gold Crab).
- Initial capital: where Risk of Ruin = 0–1% (fixed lots).
- Losing streak tolerance: plan for ≈20 consecutive losses.
- Monitor separately: Equity DD, margin usage, MAE.
- OOS / Forward tests: don’t mix with optimization period.
- Logic robustness: check for Grid/Martingale, abnormal win rates, poor RR.
Common Misunderstandings and Warnings
- Smooth MC bands ≠ safe system. Grid/Martingale risks show up on equity, not in MC.
- MC screenshots can be “authority decoration.” Some vendors show them to fake safety. True reliability comes from:
- Forward tests
- Robust, universal logic
- Avoiding over-optimization
Conclusion
Monte Carlo Analysis is a valuable tool to visualize closed-trade order risk and guide lot sizing & capital planning.
But its blind spots (Equity DD, compounding, price scaling) require separate monitoring.
👉 Don’t trust Monte Carlo alone—the real core is strategy logic robustness: forward/OOS testing, avoiding curve-fitting, and ensuring no reliance on Grid/Martingale.
For more information, please see the related article below.
Stop Chasing Win Rate: Expectancy & Risk-Reward (RR) for Choosing EAs
Avoid Overfitted EAs: A Pre-Purchase Checklist
Walk-Forward Analysis for EA Buyers: Trust Beyond Backtests