
Introduction. PF (Profit Factor) is “Total Gross Profit ÷ Total Gross Loss.” If the value is above 1, the system was net profitable over that period. It’s a useful metric, but PF alone cannot judge an EA. Always read it together with win rate, Risk:Reward (RR), and drawdown (DD).
PF definition (formula & meaning)
PF = Total Gross Profit ÷ Total Gross Loss
Let win rate be p, average win AvgWin, and average loss AvgLoss. Then:
PF = (p × AvgWin) ÷ ((1 − p) × AvgLoss) = [p × RR] ÷ (1 − p)
Note: RR (Reward:Risk) = Average win ÷ Average loss.
With the same win rate, larger RR (cut losses, let profits run) tends to lift PF, while small RR (small wins, big losses) suppresses PF.
Rough benchmarks (assuming sufficient sample)
- PF 1.1–1.3: Modest but realistic. If costs are included, it can be investable.
- PF 1.3–1.8: Healthy zone. Verify balance with DD.
- PF ≥ 2.0: Strong, but check for low trade count, missing costs, or risky logic.
Simple example
Win rate 50%, AvgWin 100, AvgLoss 80 → PF = (0.5×100) ÷ (0.5×80) = 100/80 = 1.25.
Not flashy, but it steadily builds equity.
PF vs. drawdown (DD): why PF alone is risky
Generally, higher PF correlates with shallower DD under equal conditions. But there are exceptions:
- Grid/Martingale styles: Many small wins can make PF look high, yet a rare large loss can crush the equity curve.
- Event sensitivity: A single “fat-tail” loss during a shock may not be obvious in PF until it hits.
Always read PF together with DD. Check whether Max DD is within your tolerance, and whether the Recovery Factor (Net profit ÷ Max DD) is adequate. For details, see the drawdown article.
Instability by period (sample size & regime)
- Insufficient sample size distorts PF. In backtests, aim for ≥ 500 trades on the same logic, ideally ≥ 1,000.
- Market regime (trend/range, volatility) shifts PF. Review monthly PF trends and rolling-window PF for stability.
- Always include commissions, spreads, and slippage in backtests. Without them, PF is inflated.
How to spot “abnormally high” PF (checklist)
- PF > 2.0 with low trade count (< 200) → likely luck or overfitting.
- Win rate 80–95% but RR < 1 (small wins, big losses) → grid/martingale scent. Verify largest loss and equity drop during losing streaks.
- Costs omitted (fixed spread only, no slippage) → PF will likely drop sharply in live trading.
- Cherry-picked period → regime bias. Re-test on full history, OOS, and forward.
Example of an abnormal Profit Factor
The following backtest stats and equity graph are for an EA over 2015–2020.
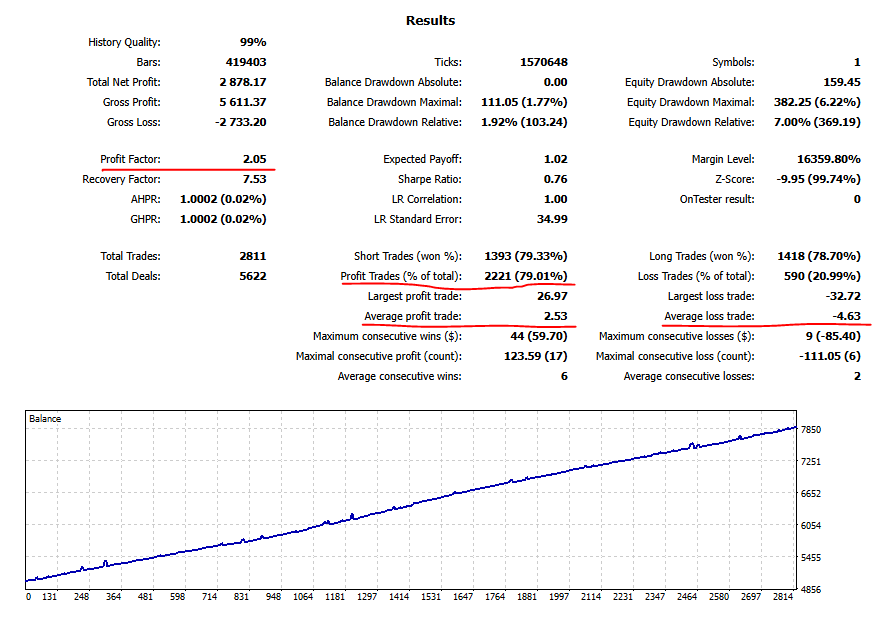
Profit Factor: 2.05 — very high — and the equity curve is beautifully smooth.
Profit Trades (% of total) = 79%; at a glance, it may look like the perfect system.
However, the next image shows the same system starting from 2015 (another span). It begins strongly, then a single large loss wipes the account.
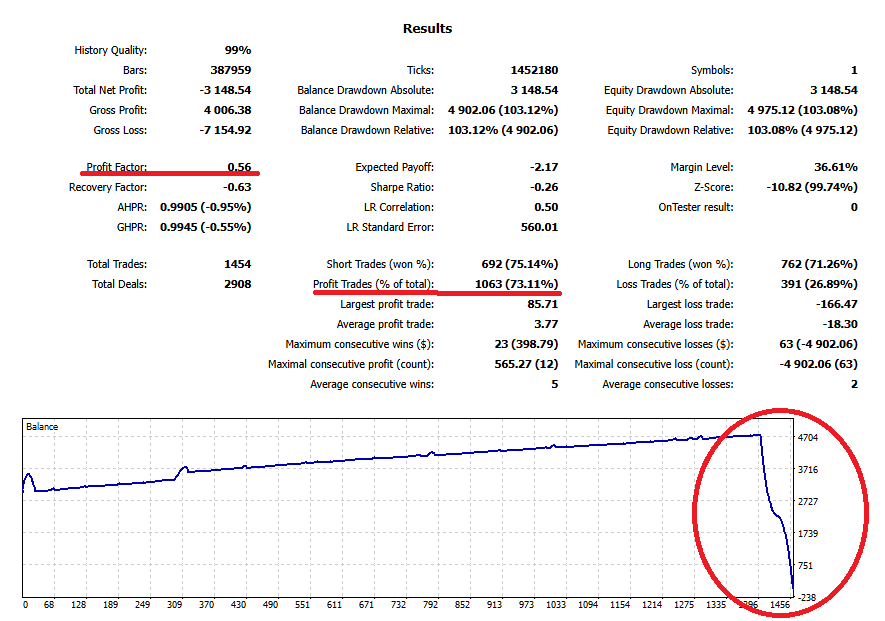
This demonstrates that a high PF alone doesn’t guarantee robustness. In fact, very high PF should trigger questions about risky or deceptive techniques.
Using PF with other metrics (turn PF into decisions)
Expectancy (Expected Payoff)
E = Win rate × Avg win − Loss rate × Avg loss. First confirm that E is positive. For details, see the expectancy × RR article.
RR (Reward:Risk)
RR = Avg win ÷ Avg loss. Aim for ≥ 1.5–2.0 if possible. With the same win rate, larger RR usually yields greater stability.
PF
PF > 1 is the minimum. 1.3–1.8 is a practical, healthy band. When PF is very high, cross-check trade count, costs, and largest loss.
DD (maximum drawdown)
Ensure it’s within your tolerance. For the same PF, shallower DD is easier to stick with. Also consider the time/return needed to recover.
Sample & forward
In backtests, verify ≥ 500–1,000 trades on the same logic. The longer the forward test, the more credible.
Summary: what to do today
- PF is a ratio of outcomes, not a magic bullet. Always read it with expectancy, RR, DD, trade count, and cost realism.
- As a rule of thumb, PF 1.3–1.8 is healthy. If PF ≥ 2.0, be ready to explain why with numbers.
- Unnaturally high win rate × low RR is a red flag. Inspect largest loss and depth of losing streaks for tail risk.
- Finally, decide based on your DD tolerance and your rules (daily/weekly loss limits, stop/restart triggers).