
Lead (Introduction)
“Boats that sink together” deepen overall drawdowns (DD). By combining currencies and EAs that behave differently—and by roughly equalizing per-position risk—your aggregate DD can become visibly smoother. This article explains the core principles of using correlation to contain DD, along with concrete, repeatable steps anyone can implement.
Objectives
- Reduce portfolio DD and stabilize the equity curve.
- Understand precautions so you don’t misuse “correlation.”
- Translate currency and EA diversification into measurable sizing and allocation rules.
Glossary
- Correlation: Degree to which two series (returns/P&L) move together (−1 to +1).
- Diversification (here): Risk diversification, not the mere count of symbols. What matters is correlation and the risk loaded on each sleeve.
- DD (Drawdown): Max peak-to-trough decline in the equity curve.
- RR (Reward/Risk): Metrics capturing “cut losses, let profits run,” e.g., average profit ÷ average loss.
- PF (Profit Factor): Gross profit ÷ gross loss. > 1 indicates edge.
Using (and Not Misusing) Correlation
Pitfalls of Pair-Correlation & Anti-Correlation Trades
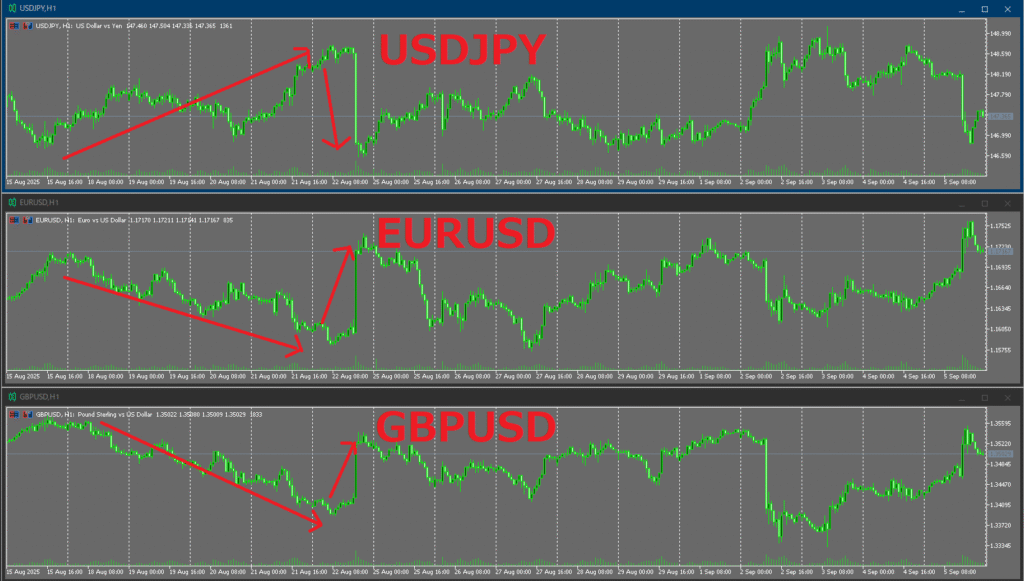
Pairs often show recognizable relationships (e.g., EURUSD & GBPUSD, AUDUSD & NZDUSD often move together). EURUSD vs. USDJPY can move opposite when USD drives both. These are tendencies, not guarantees, and they shift with regime.
A common misuse is holding opposite positions in two positively correlated pairs to “narrow P&L swings.” For example, long EURUSD and short GBPUSD is structurally similar to long EURGBP (USD legs net out). You end up paying two sets of costs (spread, commissions, slippage) vs. trading the cross directly—so “manipulating correlation” alone does not create edge.
Likewise, long EURUSD and long USDJPY approximates EURJPY-like exposure; long AUDUSD with short NZDUSD embeds AUDNZD-like exposure.
Conclusion: Correlation is not a profit source. It only helps if the trading logic already has genuine edge.
Combine Differently Behaving EAs (Low-Correlation P&L)
Trend-following and counter-trend often win in different regimes, so bundling them can smooth the combined equity curve. Typically: trending regimes favor trend-following; ranging regimes favor counter-trend.
Crucially, both EAs must show long-term edge (PF > 1 with acceptable DD and sound RR). Counter-trend can look good short-term but often devolves into small-win/large-loss patterns that fail on long OOS/forward tests. In long horizons, trend-following tends to retain edge more reliably. Mixing weak EAs adds drag and can worsen long-run outcomes.
Diversifying by Currency Pairs (Recommended)
Rolling out a single robust logic across multiple pairs often reduces total DD. If identical logic and parameters work on several pairs, it suggests lower risk of single-pair overfitting and greater robustness.
Example:Colorful Long tailed Tit EA is intended to run the same logic/params on EURUSD, GBPUSD, USDJPY.
Below are the profit and loss graphs for each of the three EA pairs, EURUSD, GBPUSD, and USDJPY, as well as a graph combining the three. The combined curve shows less stagnation and drawdown than the curve for a single currency pair.
Toward the end of the testing period, USDJPY compensated for the stagnation of EURUSD and GBPUSD.
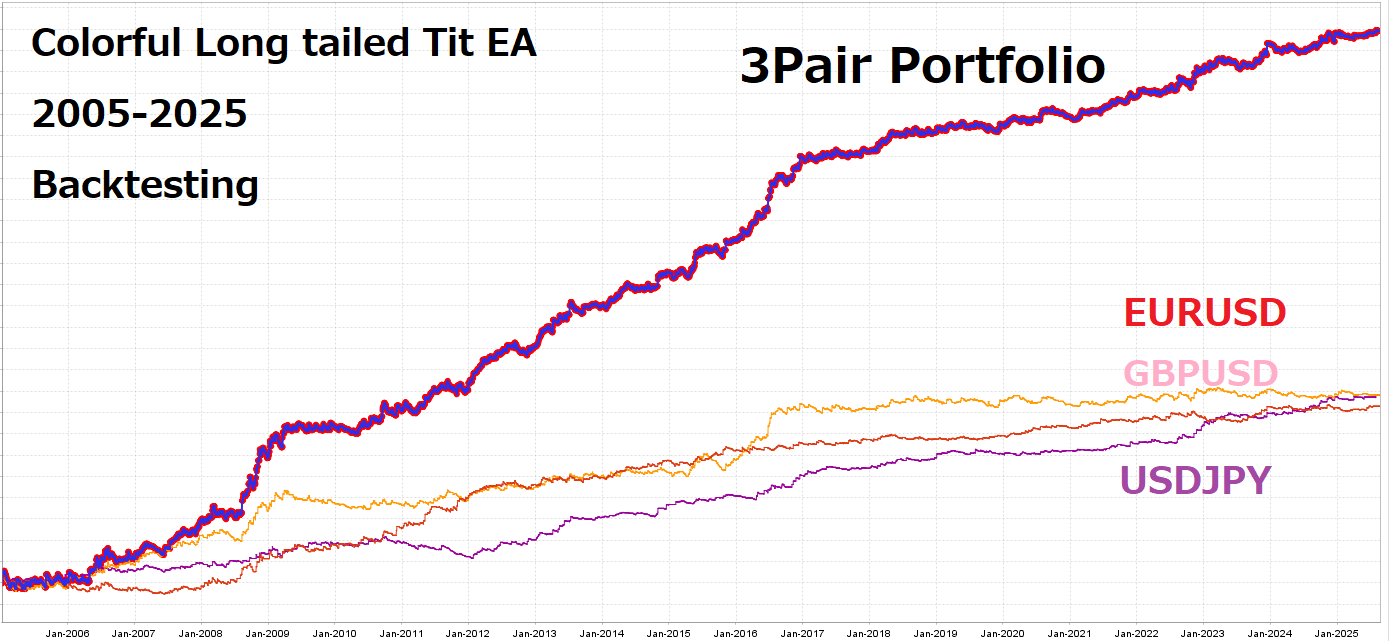
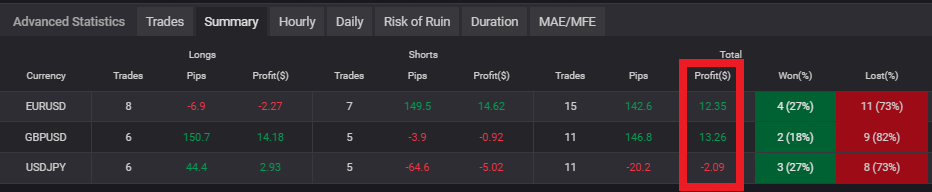
In current forward, USDJPY alone may be negative while EURUSD and GBPUSD are positive, potentially offsetting and reducing portfolio DD.
Backtests often show that the same EA applied to different pairs can yield weakly correlated P&L paths.
Exceptions: In market-wide structural episodes (e.g., unusually low volatility across majors and gold), multiple pairs can stagnate together, causing simultaneous DD. Correlation is time-varying—expect it to change with regime.
Critical Point When Diversifying Pairs: Match Risk, Not Lots
Equal lot sizes do not mean equal risk. Tick/Pip value and typical volatility differ by symbol.
- Example: 0.10 lot on EURUSD vs. 0.10 lot on XAUUSD—the latter typically swings more per day.
- Fix: Size by expected volatility (e.g., ATR) or stop distance, equalizing per-position risk as a % of equity (or as a fixed cash amount), not by lots.
Practical Basics (Simple Working Rules)
- Keep per-position risk constant (as % of equity).
Position Size = Allowed Risk ($) ÷ (Stop Distance × P&L per price unit) - Volatility-leveling across pairs. Allocate weights inversely to recent volatility (e.g., ATR or return st.dev. over the last few months).
- EA-level risk parity (simple). Equalize by expected max DD or annualized vol across EAs to prevent any single sleeve from dominating.
How to Choose “Good EAs” (Working Benchmarks)
- PF benchmark: Over a long horizon including OOS, aim for PF > 1.2–1.5 as a rough threshold.
- RR benchmark: Average profit ÷ average loss ≥ 1.0 (preferably 1.2–1.5+).
- Consistency: Stability in monthly PF/win rate; streak distributions (max losing/winning streaks) within tolerance.
- Generality: No dramatic collapses across several pairs/timeframes.
- Sound validation: Avoid data leakage/parameter recycling; use walk-forward or time-series splits to curb overfitting.
Related articles (placeholders): Profit Factor (PF) Explained: Benchmarks & Pitfalls / Walk-Forward Analysis for EA Buyers / Stop Chasing Win Rate: Expectancy & Risk-Reward (RR) for Choosing EAs
How to Measure Correlation (What Exactly to Correlate)
- Correlate P&L/returns, not prices. Use EA-level P&L (or returns) per evaluation bucket. Because short horizons are noisy, monthly windows are recommended.
- Use rolling correlation to track regime change. Compute moving correlation over the past few months and tighten allocations when relationships shift abruptly.
Common Misconceptions & Fixes
- “Correlation makes you win” → False. Profit comes from edge; correlation shapes variance.
- “Correlation is constant” → False. It’s regime-dependent and often spikes during stress.
- “Same lots = diversified” → False. Pip value and volatility differ; equalize risk, not lots.
- “More pairs = always safer” → False. Many highly correlated pairs ≈ one bet in disguise.
Operational Checklist
- Do all EAs meet long-term PF/RR/max-DD thresholds?
- Any currency overlap or correlation clustering visible in your correlation matrix?
- Are you sizing by expected vol/stop distance rather than by lots?
- Do you enforce allocation caps to avoid single-EA or single-pair concentration?
Summary
- The essence of smoothing DD is edge-bearing EAs × low correlation × risk leveling.
- Adding more currencies/EAs is insufficient—quantify correlation and equalize intended risk.
- Avoid bundles of EAs that are highly correlated on the same pair; favor pair diversification.
- Size by P&L impact (money risked), not by lots.
- Treat correlation as time-varying; review and rebalance regularly for long-term robustness.